The latest release of the RCD Nexus portal provides new functionality to explore and visualize the community dataset provided by institutions that are using the CaRCC Capabilities Model and/or have contributed their capabilities assessment data. With this release, users can also benchmark their institutional capabilities coverage relative to the community of contributors. Visit portal.rcd-nexus.org/dataviz and try out the new functionality! If you have questions, complaints, or kudos, please let us know by emailing the RCD CM working group at capsmodel-help@carcc.org.
Keep reading for more details about the new functionality.
This work is supported by the National Science Foundation under Grant OAC-2100003.
New data exploration functionality
Graphical display of information about the institutions in the community dataset (“Community Demographics”), including various maps and charts that visualize the institutions using the CaRCC Capabilities Model, and show the proportions by Institutional classification, Mission, EPSCoR Status, and several other measures.
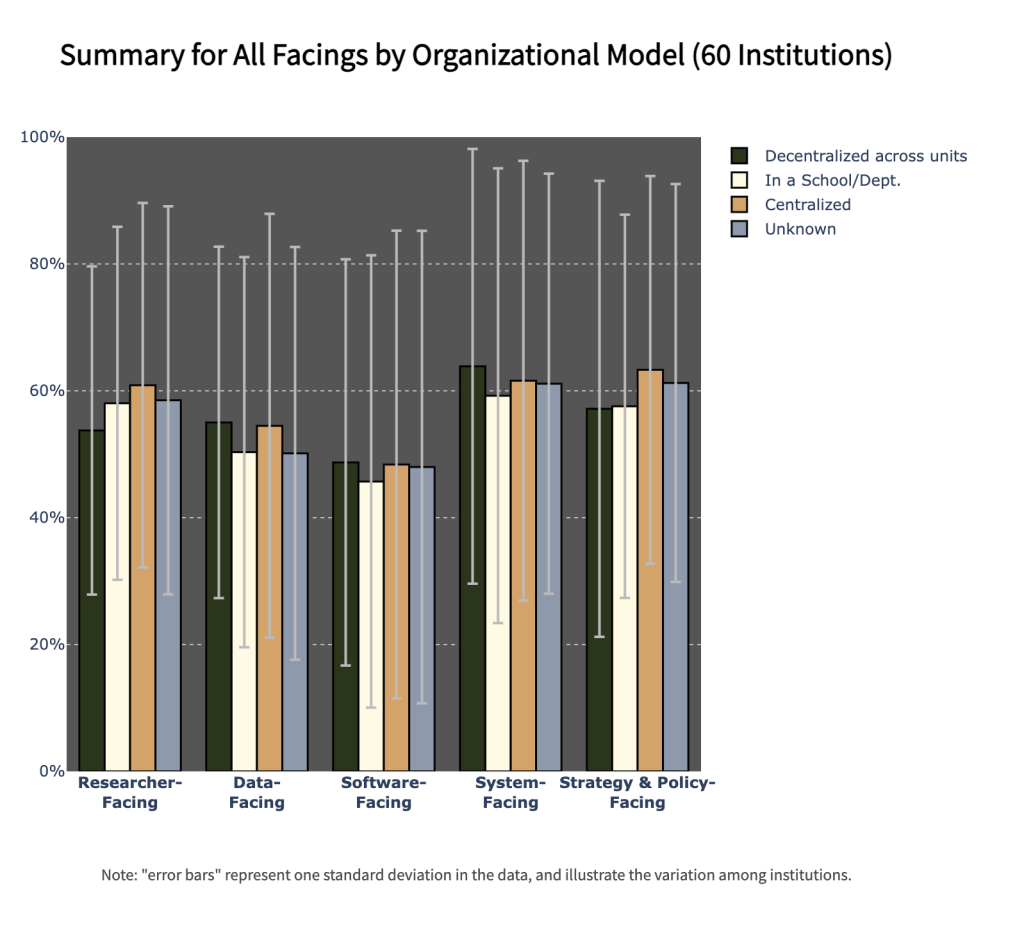
Graphical display of Capabilities Model assessment data in the community dataset (“Capabilities Data and Benchmarking”). This provides both summary averages for the community for each Facing, as well as “drill-down” graphs that show average coverage for the topics in each of the Facings. This data can be viewed as simple summary graphs, or in visualizations that compare institutions in various ways, including Institutional classification (e.g., R1 vs. R2), Public vs. Private, EPSCoR vs. non-EPSCoR, etc.
Filtering support to explore the data: For each of the visualizations, users can filter the data to define and explore data about specific sub-communities. The filters range from Institutional classification, to Public or Private, to Research Expenditures.
- Filters can be combined so that users can, for example, filter the view to include only Public institutions in EPSCoR jurisdictions with research expenditures under $500M.
- Users can bookmark or share a favorite visualization (as a URL).
Benchmarking support: In addition to the display of community data, you can choose to overlay values from an approved assessment for your institution to benchmark your capabilities coverage relative to a filtered set of peers. You can benchmark at the summary (Facings) level, or drill down to benchmark on the topics in each Facing.
Other changes and improvements
We’ve made a number of smaller improvements in the user-interface and services supporting the Capabilities Model Assessment tool, and imported additional metadata about the institutions using the tools.
For a full description of the new functionality and other changes, see the Release notes for this version.