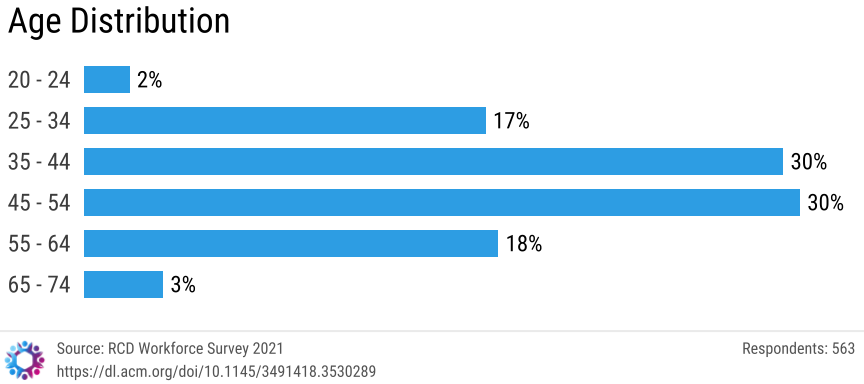
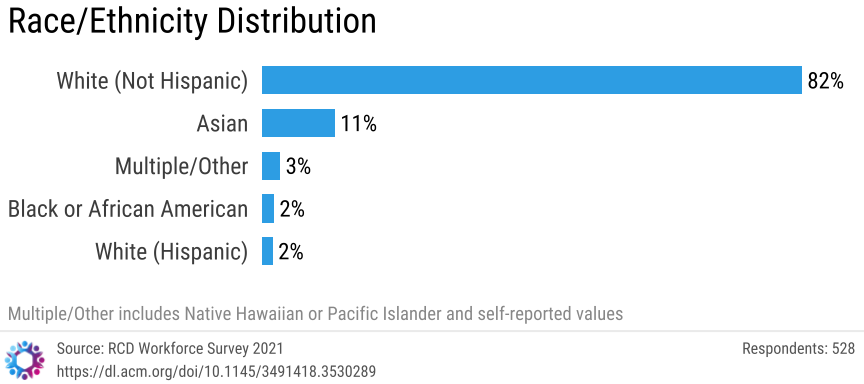
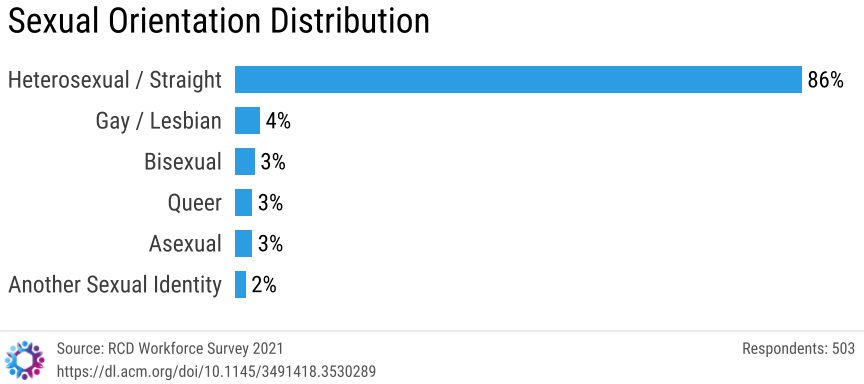
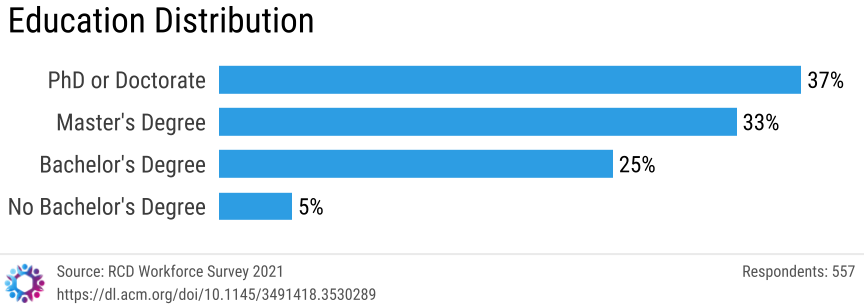
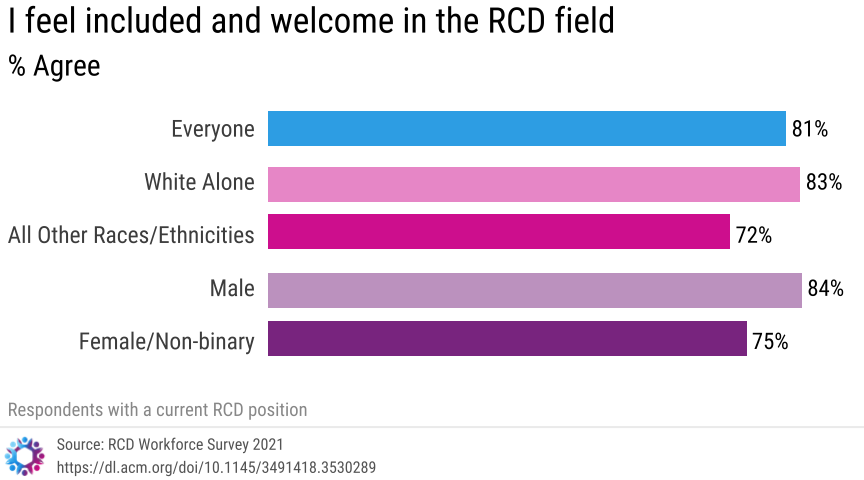
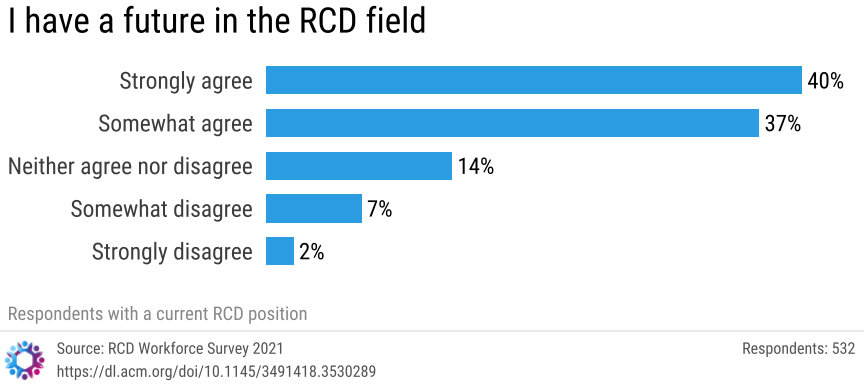
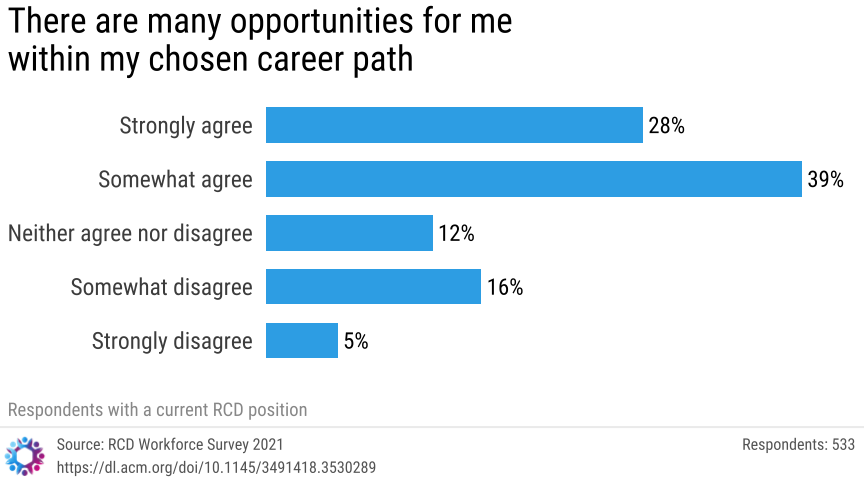
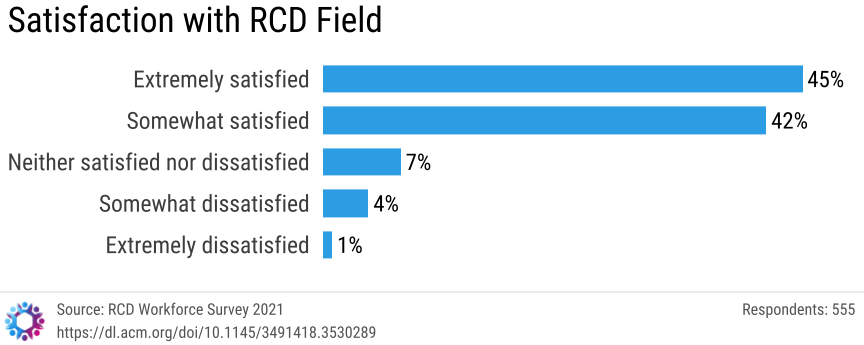
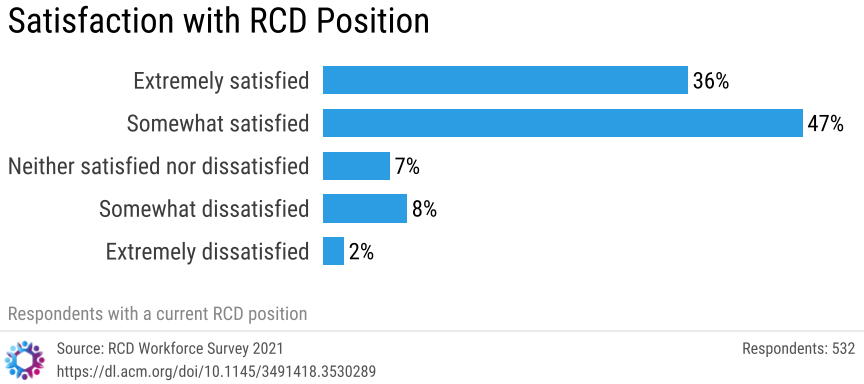
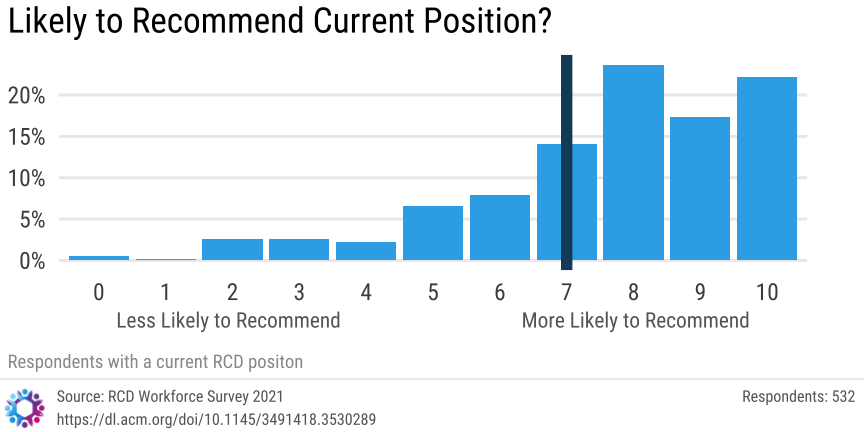
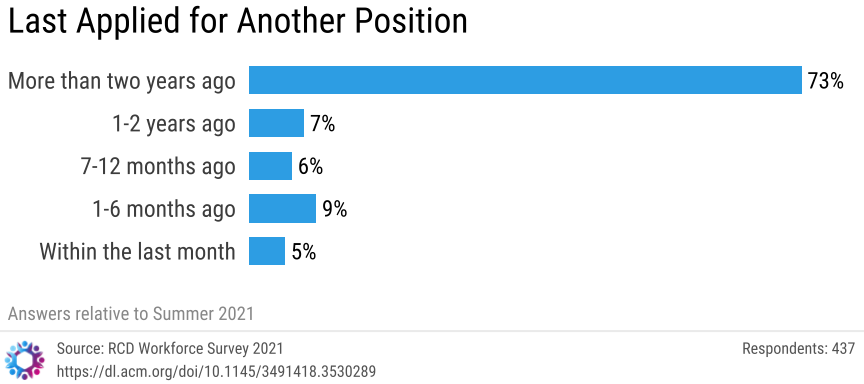
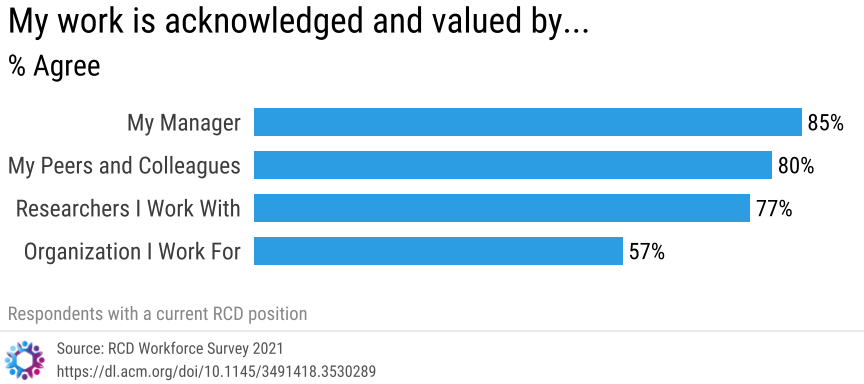
The CaRCC Research Computing and Data (RCD) Professionalization working group conducted a survey of RCD professionals in summer 2021. The visualizations below present the results of that survey.
Survey questions are available at:
The survey received 563 valid, unique responses that were included in the analysis; 539 respondents are currently employed in a position with RCD responsibilities. 452 respondents work for an academic institution. For context, the professionalization working group estimates there are at least 5,000 RCD professionals working at academic institutions.
Results regarding the workforce demographics are published in: Christina Maimone, Scott Yockel, Timothy Middelkoop, Ashley Stauffer, and Chris Reidy. 2022. Characterizing the US Research Computing and Data (RCD) Workforce. In Practice and Experience in Advanced Research Computing (PEARC ’22), July 10–14, 2022, Boston, MA, USA. ACM, New York, NY, USA, 7 pages. https://doi.org/10.1145/3491418.3530289
Result regarding compensation is published in: Christina Maimone, Carrie Brown, Kimberly Grash, Chris Reidy, and Ashley Stauffer. 2023. Compensation of Academic Research Computing and Data Professionals. In Practice and Experience in Advanced Research Computing (PEARC ’23). Association for Computing Machinery, New York, NY, USA, 145–152. https://doi.org/10.1145/3569951.3593599
Data visualizations are licensed CC BY-NC-SA (attribution is already part of the image files), or download the data and create your own.
Additional data from the survey is still being analyzed.
Demographics
Download Chart: Age | Race/Ethn. | Gender | Sex.Orient. | Disability | U.S. Res.
Education
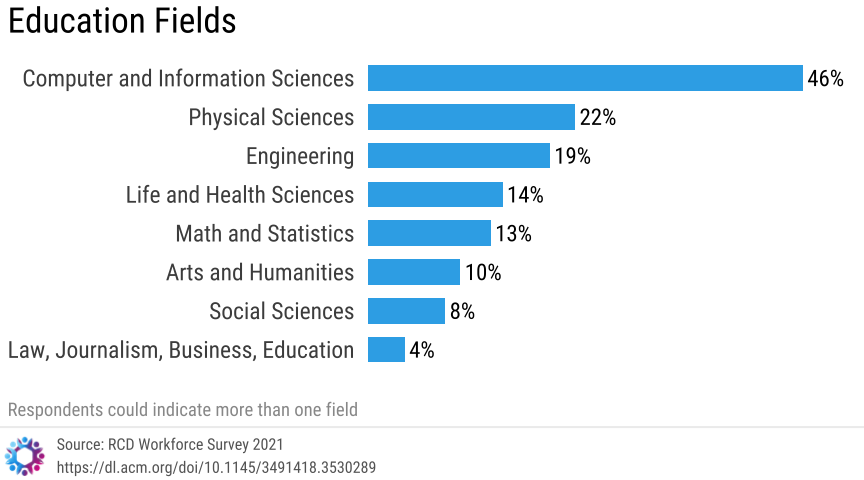
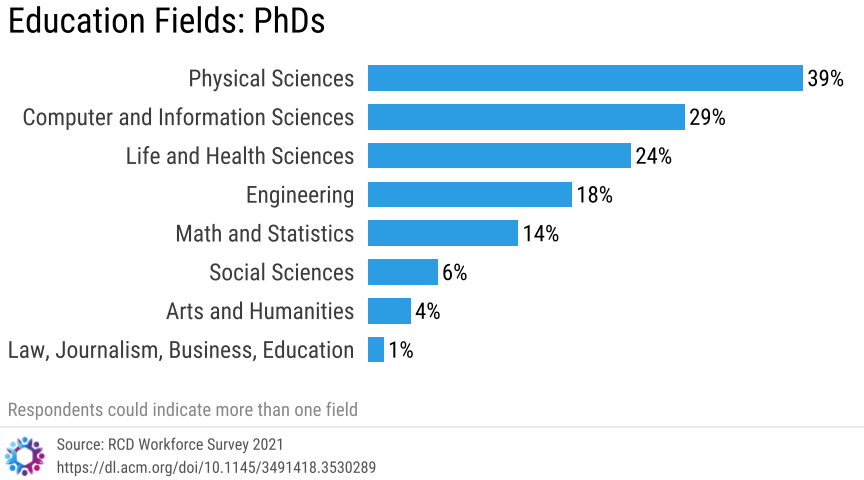
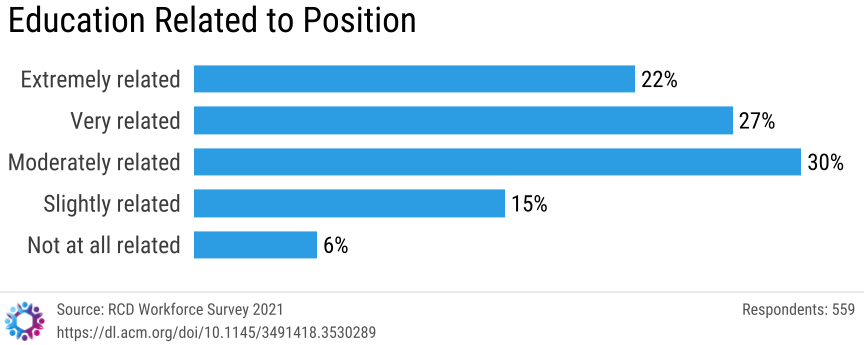
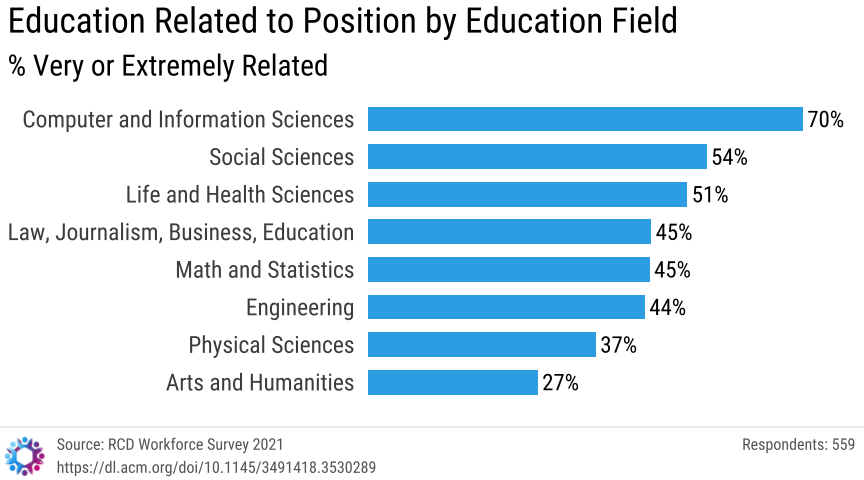
Download Chart: Edu. Dist. | Edu. Fields | Edu. Fields: PhDs | Rel. to Pos. | Rel. to Pos. by Field
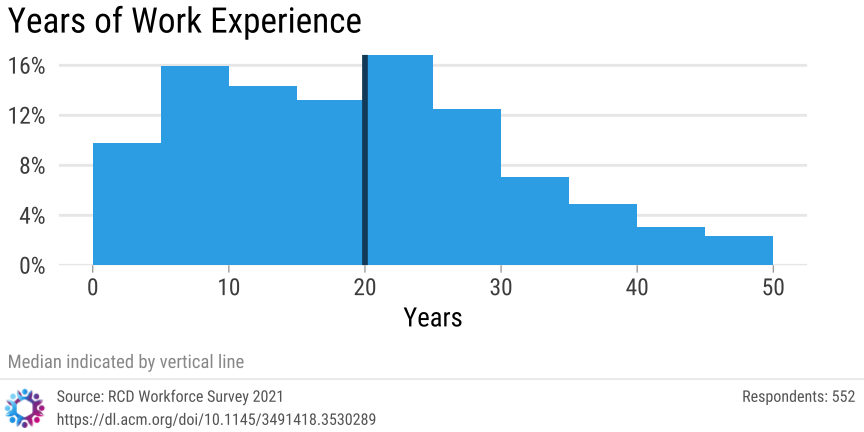
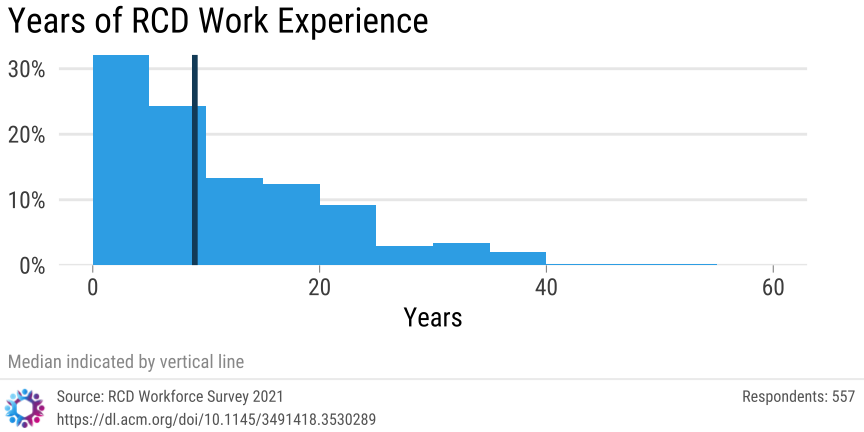
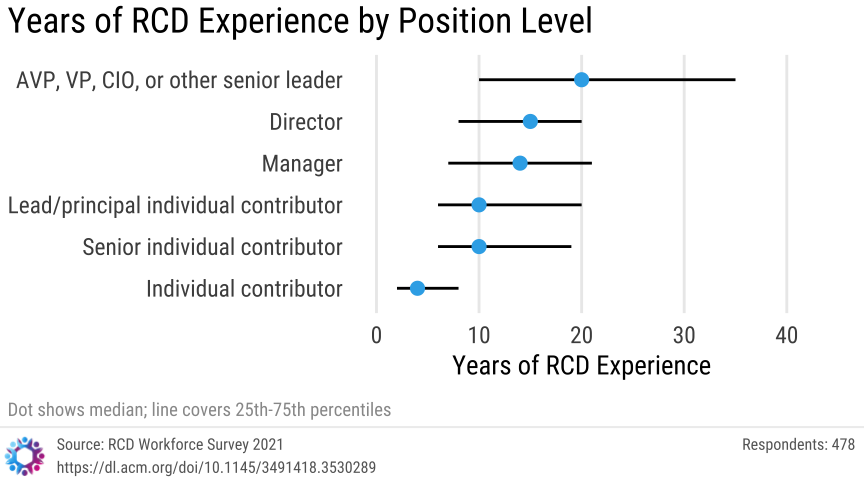
Work Experience
Download Chart: Work Exp. Yrs | RCD Work Exp. Yrs | RCD Work Exp. % | Exp. by Pos.
Current Position
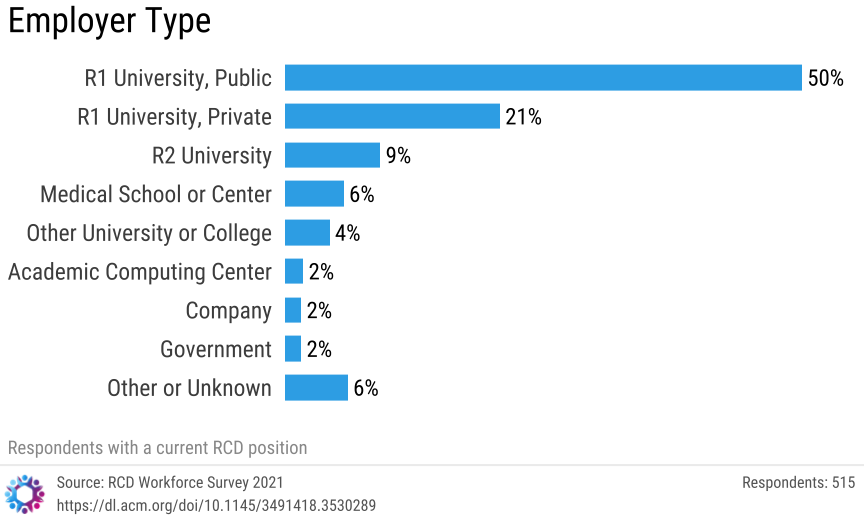
Download Chart: Employer Type
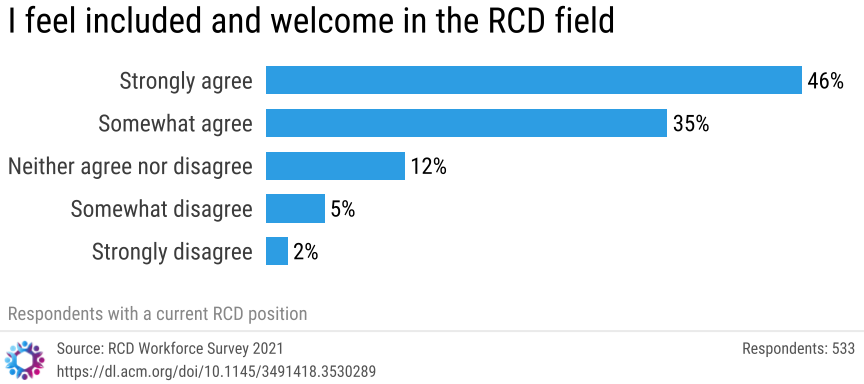
Experience with RCD Field and Position
Download Chart: Feel Welcome | Welcome by Groups | Have Future | Opportunities | Satisfied w/ Field | Satisfied w/ Pos. | Recommend | Applied | Valued

